


© 2023, Мелихова Галина Петровна 259 1

СДЕЛАЙТЕ СВОИ УРОКИ ЕЩЁ ЭФФЕКТИВНЕЕ, А ЖИЗНЬ СВОБОДНЕЕ
Благодаря готовым учебным материалам для работы в классе и дистанционно
Скидки до 50 % на комплекты
только до
Готовые ключевые этапы урока всегда будут у вас под рукой
Организационный момент
Проверка знаний
Объяснение материала
Закрепление изученного
Итоги урока
Была в сети 31.10.2026 11:23
Мелихова Галина Петровна
Учитель английского языка
 5 122
 12 690

Специализация
Разработка урока "Рисуем числа"
Категория:
Английский язык
22.03.2023 23:33

Просмотр содержимого документа
«Разработка урока "Рисуем числа"»
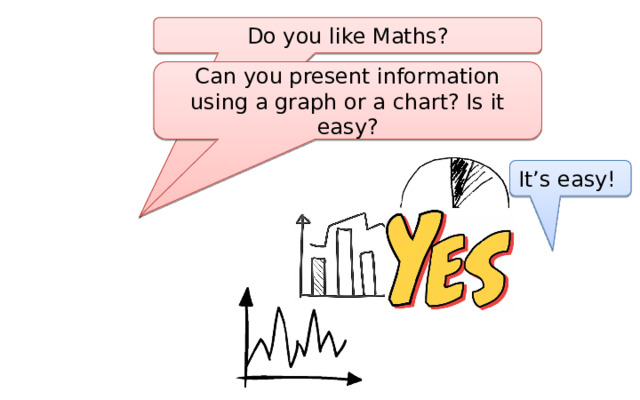
Do you like Maths?
Can you present information using a graph or a chart? Is it easy?
It’s easy!

Let’s study three popular types of graphs .
wordlist
Drawing Numbers
to give
Fill in:
- which
- we
- are
- a
- is
- be
a
are
the pie chart
the bar graph
the line graph

Watch the video and enjoy it.
wordlist
The Line Graph
Fill in:
we
- which
- we
- are
- a
- is
- be
How many sweets do you eat during a week?
It depends.

wordlist
The Bar Graph
Fill in:
be
- which
- we
- are
- a
- is
- be
is
to discover differences and similarities between things
What is your favourite chocolate?
wordlist
The Pie Chart
Fill in:
which
- which
- we
- are
- a
- is
- be
What chocolate do you prefer?
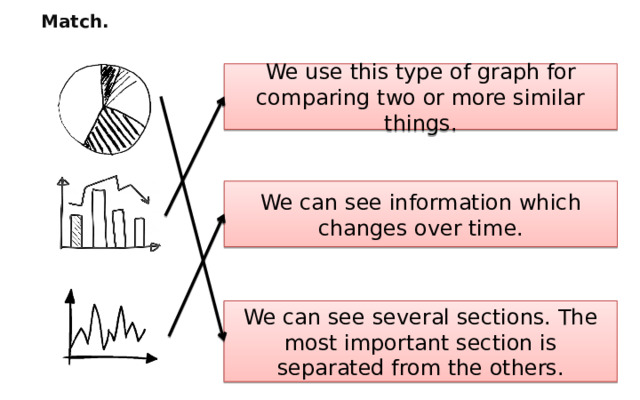
Match.
We use this type of graph for comparing two or more similar things.
We can see information which changes over time.
We can see several sections. The most important section is separated from the others.
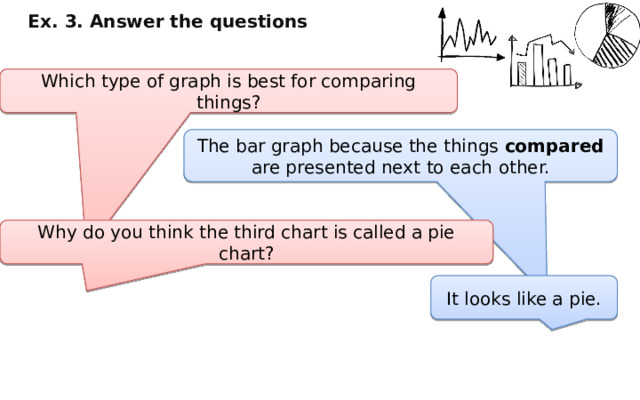
Ex. 3. Answer the questions .
Which type of graph is best for comparing things?
The bar graph because the things compared are presented next to each other.
Why do you think the third chart is called a pie chart?
It looks like a pie.

Ex. 4. Which type of chart would you use to present the following information?

Ex. 6. In pairs carry out a survey about an important aspect of your school life (clubs, school meals). Make a graph to show the result. Present it.
Students: N
- N (%)
- N (%)
- N (%)
- N (%)

Watch the video and enjoy it .
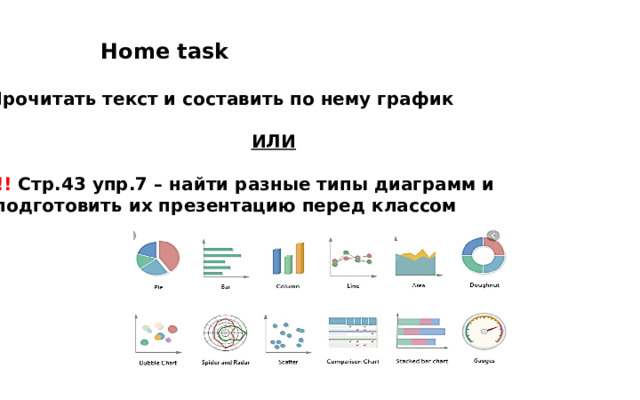
Home task
Прочитать текст и составить по нему график
ИЛИ
!!! Стр.43 упр.7 – найти разные типы диаграмм и
подготовить их презентацию перед классом

Ex. 7. Project. Find various types of graphs. Bring them to the class and explain them.
Комплекты видеоуроков для учителей
Похожие файлы
Вебинар для учителей
🎓 Свидетельство об участии ✨БЕСПЛАТНО!✨